.avif)
📌 Key Takeaways
A defensible business case for resident experience platforms requires quantified pilot results, transparent total cost modeling, and security frameworks that satisfy cross-functional approvals.
- Orchestration Delivers Value, Not Features: Unified platforms consolidate fragmented workflows across property management, access control, and communication systems into standardized playbooks with measurable SLA adherence, delivering the seamless execution that defines modern luxury living by eliminating operational latency.
- TCO Extends Beyond Subscription Fees: Accurate financial modeling accounts for four distinct cost layers—platform licensing, integration build and maintenance, data governance and migration, and change management—with transparent assumptions that prevent implementation surprises.
- Pilot-First Validation De-Risks Commitment: A 30-60 day pilot measuring leading indicators like time-to-resolution and engagement rates alongside lagging outcomes like renewal lift provides evidence-based approval confidence before portfolio-wide investment.
- Portfolio-Specific Data Trumps Industry Benchmarks: Internal time studies for labor savings, historical turnover costs for renewal lift calculations, and baseline SLA measurements during pilots produce accurate ROI projections, while generic industry figures risk inflated expectations and failed business cases.
- Security Alignment Accelerates Approvals: Mapping platform controls to NIST Cybersecurity Framework 2.0, ISO/IEC 27001:2022, and CISA Zero Trust principles demonstrates governance maturity that satisfies IT and compliance gatekeepers through recognized standards rather than vendor claims.
Prepared operators build business cases on measured baselines, not optimistic assumptions.
Regional operations directors coordinating finance, IT, and on-site teams across Class A multifamily portfolios will find the strategic framework here, preparing them for the detailed justification methodology that follows.
The challenge is not in the vision for elevated resident experience, but in quantifying the return on operational investments. Without clear metrics tying platform capabilities to retention rates and labor optimization, the proposal risks being seen as a tactical expense rather than a strategic asset that secures property valuation.
Regional operations directors across Class A multifamily portfolios face this obstacle: translating resident experience improvements into language that finance teams understand and approve. The business case needs to demonstrate not just what a resident experience platform does, but precisely how it moves the needle on retention, service level agreements, and total cost of ownership—all while delivering the hospitality-grade service that defines modern luxury living.
This justification model provides a structured framework for building that defensible business case. By the end, you'll have a clear methodology for quantifying pilot results, mapping TCO across all cost layers, and addressing the security and integration concerns that often block approvals at the final stage.
What a UREP Is—and Why Orchestration Beats Feature Fragmentation
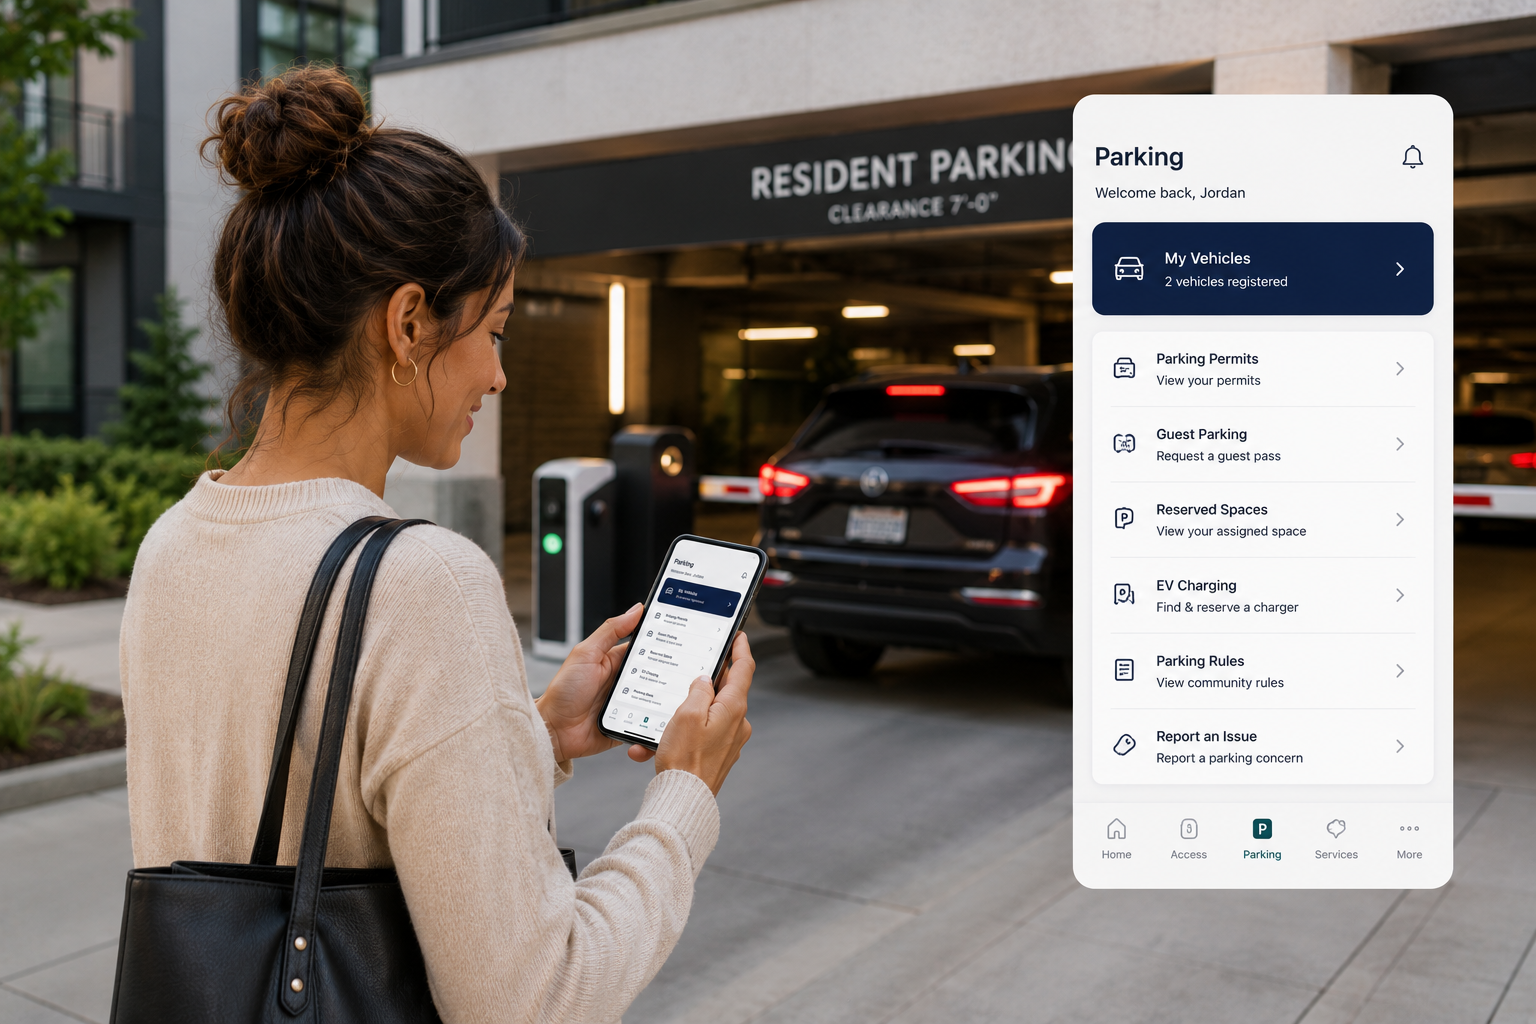
A unified resident experience platform orchestrates and measures every resident-facing workflow across systems. Think of it as a control tower for resident operations—coordinating move-in provisioning, service request routing, amenity reservations, and communication workflows through a single operational layer rather than managing disconnected point solutions.
The core distinction matters here. Feature fragmentation happens when properties accumulate individual tools for package tracking, maintenance requests, amenity booking, and resident messaging. Each system operates independently, creating disconnected data architecture and forcing staff to navigate multiple systems. A resident engagement platform consolidates these workflows into standardized playbooks with measurable SLA adherence.
Essential modules include work order and ticket triage, move-in and move-out orchestration, messaging and CRM integration, identity and access provisioning, and service request routing. The platform's value emerges from how these components connect to your existing property management system and access control providers, creating seamless resident journeys measured against defined service level agreements.
From the resident perspective, this orchestration translates to curated convenience—booking a private chef or reserving a penthouse lounge in under two minutes, with consolidated access updates, fostering the feeling of belonging to an impeccably managed, hospitality-grade community. Operators value the reliability and partner responsiveness that enable consistent feature delivery across entire portfolios.
The Costs You Must Count (TCO Beyond Licenses)
Building an accurate total cost of ownership model requires accounting for four distinct cost layers. Platform subscription represents the baseline—typically structured as per-unit monthly fees with tier pricing based on portfolio size. Integration build and maintenance costs follow next, covering the technical work to connect the platform with major PMS vendors and access control systems.
Data governance and migration represent a third cost layer that operators frequently underestimate. Moving resident data, historical service records, and access credentials from legacy systems requires careful planning, validation testing, and ongoing data quality monitoring. The fourth layer addresses change management and training—not just initial onboarding but sustained support as staff roles evolve and new features deploy.
Finance teams scrutinize these costs differently. The subscription fee appears straightforward, but the integration layer introduces variables: custom API development for older systems, ongoing maintenance as vendor platforms update, and technical resources for troubleshooting. Change management costs compound over time if adoption lags or if the platform requires frequent retraining as workflows change.
Transparent TCO modeling acknowledges these realities upfront. When property manager software integrations require custom development, that development becomes a line item with ongoing maintenance implications. When data migration reveals quality issues in source systems, remediation costs enter the model as documented assumptions rather than surprises during implementation.
Benefits Model: Renewal Lift, SLA Adherence, and Labor Hours Avoided
Quantifying benefits requires mapping platform capabilities to operational outcomes that drive shareholder value. Renewal lift emerges as the primary financial driver—even a two to three percentage point improvement in renewal rates at a 300-unit property delivers substantial returns when benchmarked against turnover costs. The connection runs through resident satisfaction metrics: streamlined service request resolution, friction-free amenity management, and consistent communication create the experience quality that drives retention decisions.
SLA adherence provides the second benefit bucket. Standardized workflows with automated escalation paths reduce service request resolution times and eliminate unresolved requests. The pilot period provides the only reliable indicator of improvement potential for your specific portfolio. While some properties transitioning from email-based or paper workflows have reported improvements of 15-25% in first-response times, this figure represents favorable case studies and should not be used in expected ROI projections. Properties already using structured ticketing systems typically see more modest gains. Actual results depend entirely on baseline operational maturity—measure your current average time-to-resolution during the pilot against your historical baseline to determine realistic improvement ranges. These measurable reductions in ticket reopens and resolution times serve as leading indicators of operational efficiency that translate to resident retention improvements and the elevated service standards residents expect from premium communities.
Labor hours avoided represent the most directly quantifiable benefit. When maintenance coordinators spend 30 minutes daily navigating multiple systems to triage requests, that's 10+ hours monthly per coordinator. Before projecting access provisioning savings, conduct an internal time study of your current move-in workflow to establish an accurate baseline. Access credential provisioning time varies dramatically based on system complexity. Properties managing multiple disconnected systems—separate logins for PMS, access control portals, package lockers, and parking systems—represent a high-complexity scenario where manual processes might consume 45-60 minutes per move-in. Simpler environments with integrated or fewer systems require substantially less time. Use your time study results, not industry examples, as the foundation for labor savings calculations.
The benefits model connects these outcomes to financial impact through conversion factors. Renewal lift converts through documented turnover costs, which can range from one to four months of rent depending on market conditions, property class, and operational efficiency. Class A properties in high-cost markets may experience costs at the higher end of this range when accounting for vacancy loss, make-ready, and marketing expenses. Use your portfolio's historical turnover data as the foundation for this calculation rather than industry averages. Organizations like the National Multifamily Housing Council and National Apartment Association publish regional benchmarks that can validate your internal figures. SLA improvements convert through resident satisfaction scores correlated with renewal probability. Labor savings convert through loaded hourly rates for staff time redeployed to revenue-generating activities and elevated resident service.
Pilot First: KPIs and Leading Indicators to De-Risk Approval
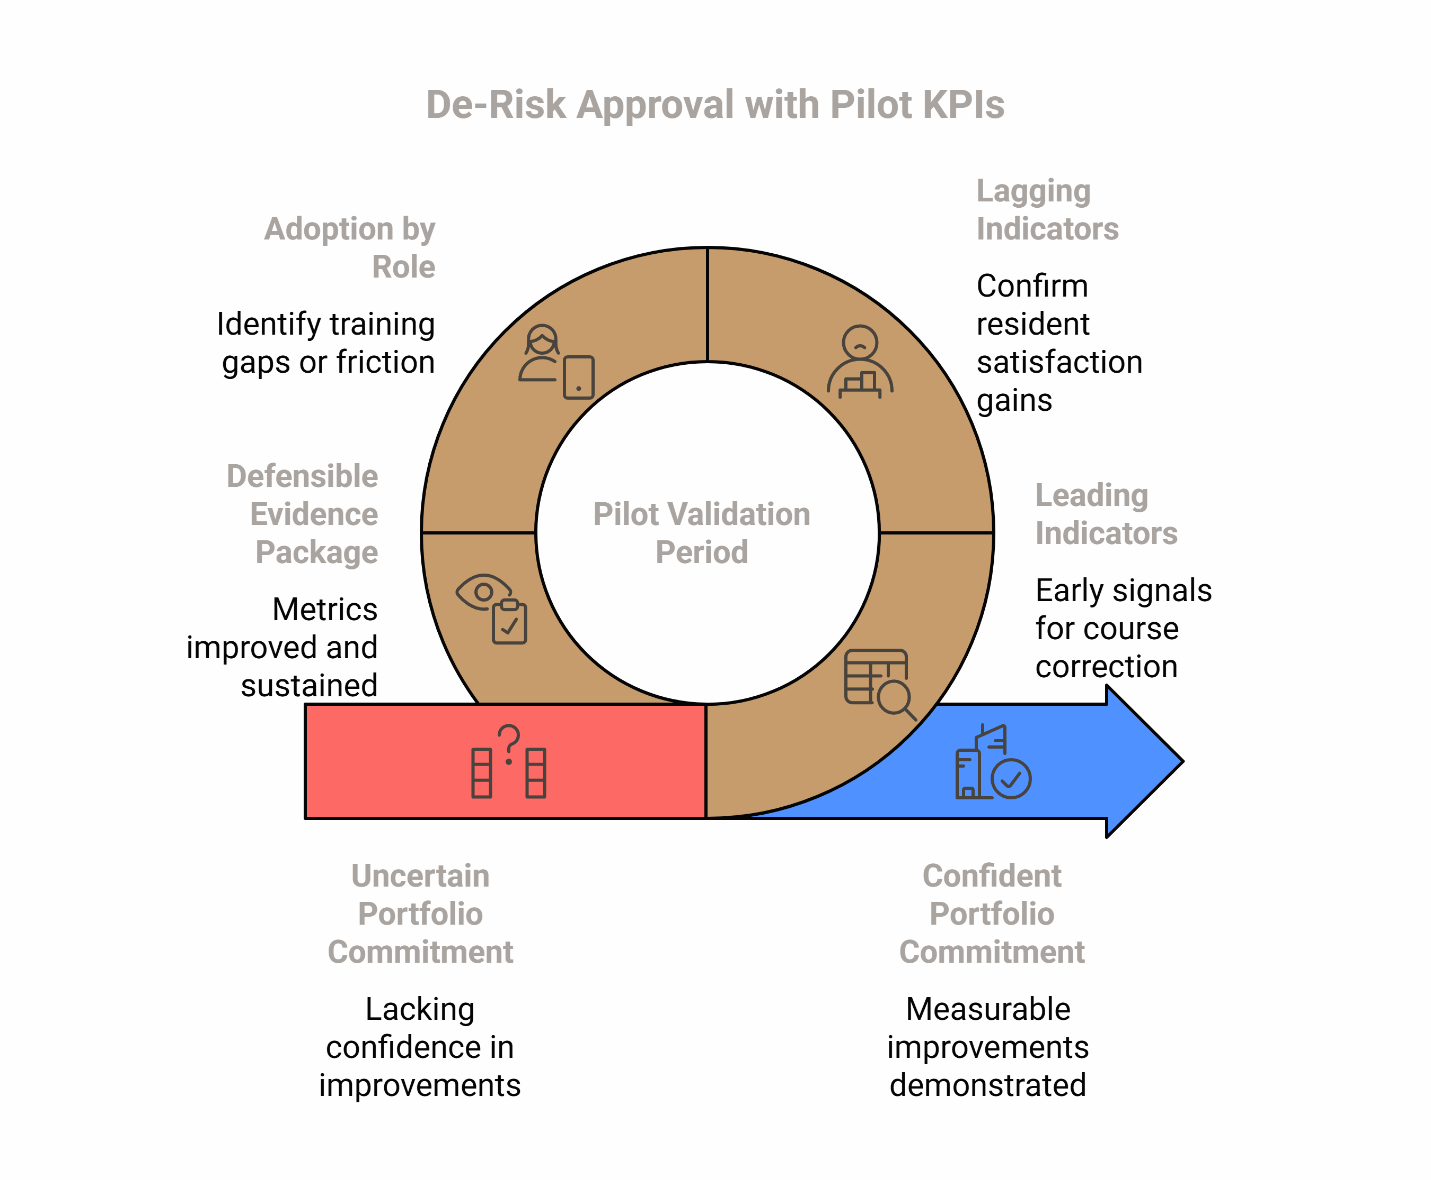
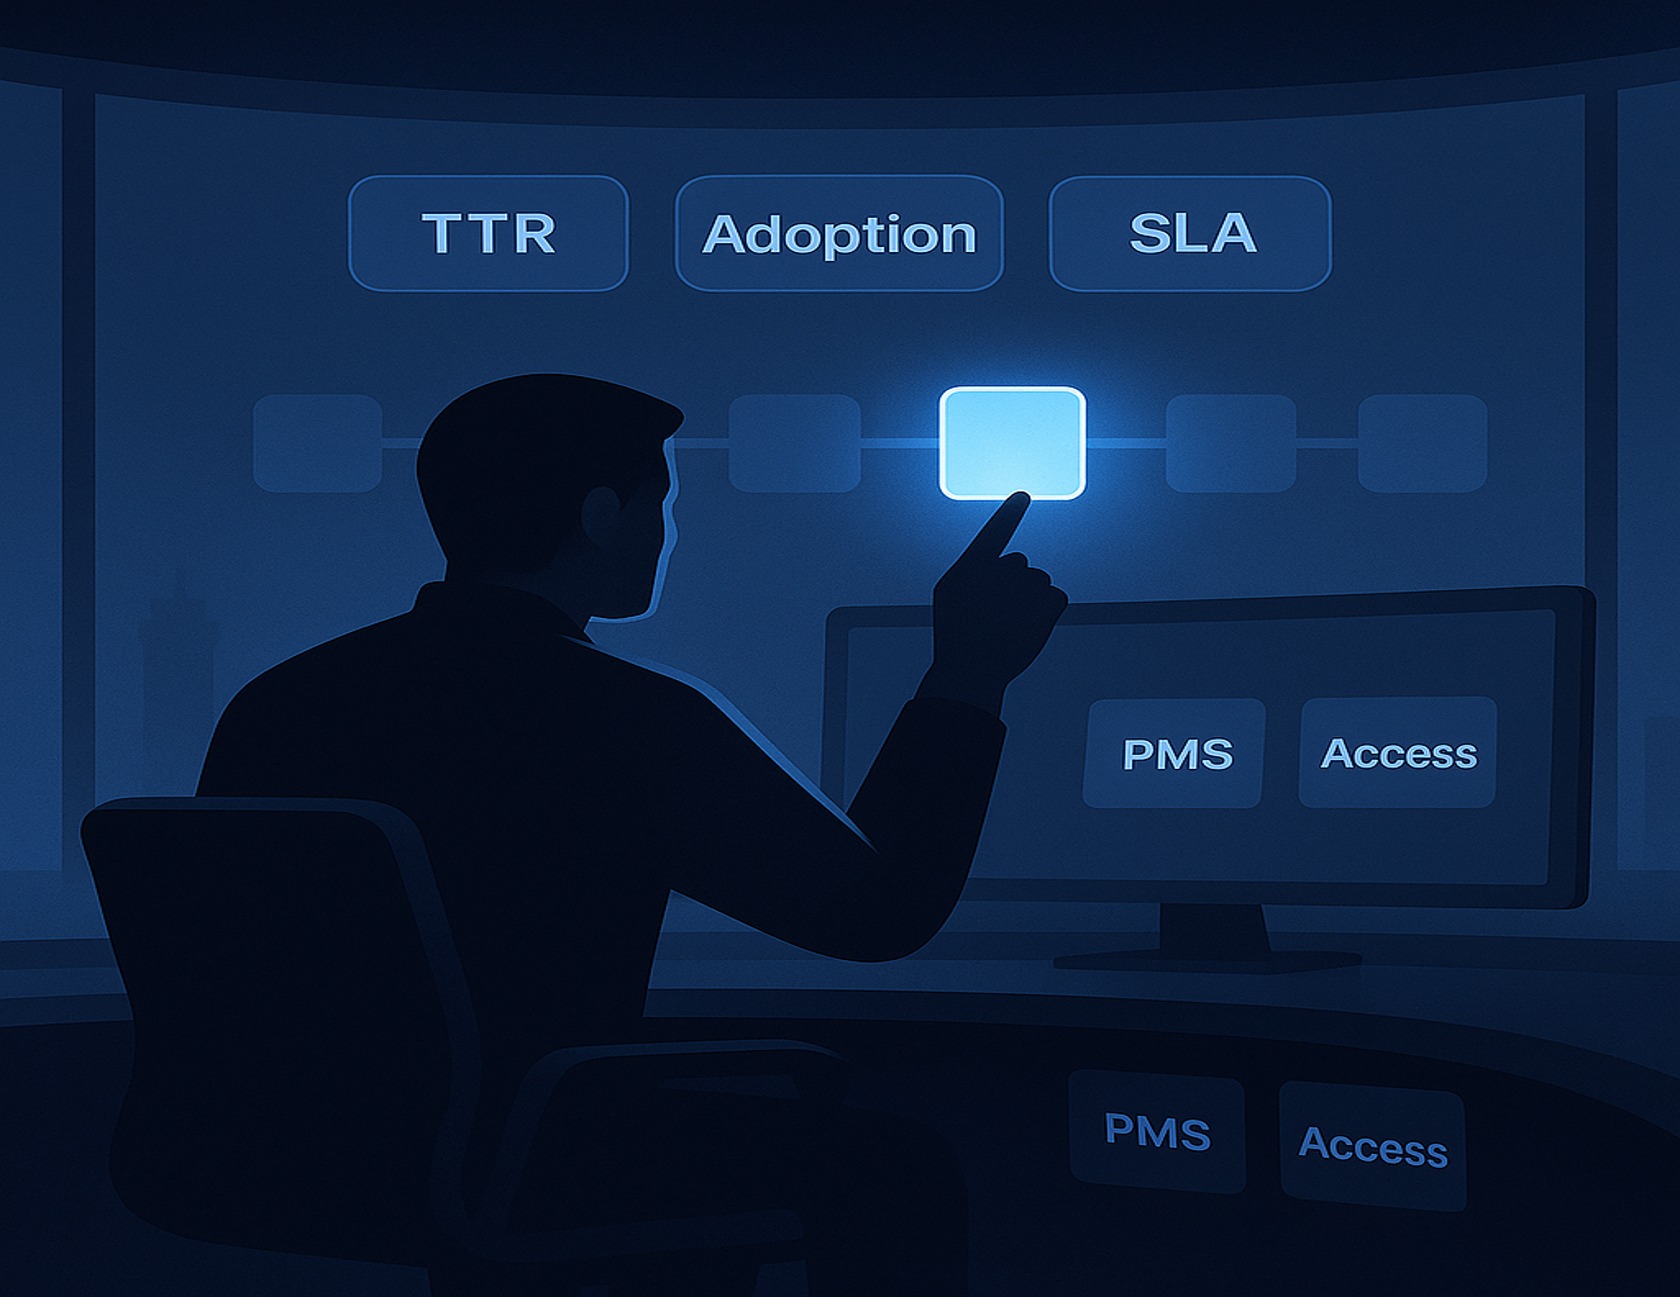
A 30-60 day pilot validation period builds decision confidence by demonstrating measurable improvements before portfolio-wide commitment. Leading indicators provide early signals: time-to-resolution for service requests, engagement rates with platform features, amenity utilization compared to baseline, and adoption rates by staff role. These metrics surface within the first month, allowing course corrections before the pilot concludes.
Lagging indicators require longer observation windows but carry greater weight in final approvals. Renewal decisions at pilot properties, net promoter score changes, and ticket reopen rates reveal whether operational improvements actually translate to resident satisfaction gains. The pilot runbook should specify measurement protocols for both indicator types, with weekly check-ins on leading metrics and monthly reviews of lagging indicators.
Adoption by role deserves particular attention during pilots. If front-desk staff embrace the platform but maintenance coordinators resist, that signals training gaps or workflow friction requiring remediation. If residents download the resident app but rarely engage beyond initial exploration, that suggests either limited feature value or unclear communication about available services.
Successful pilots produce defensible evidence packages: time-stamped service request data showing resolution improvements, engagement analytics demonstrating adoption curves, and resident feedback connecting platform features to satisfaction gains. Finance teams want to see not just that metrics improved, but that improvements sustained beyond the novelty period and that the pilot environment reasonably represents the broader portfolio.
Finance Lens: ROI/Payback Calculation Walkthrough
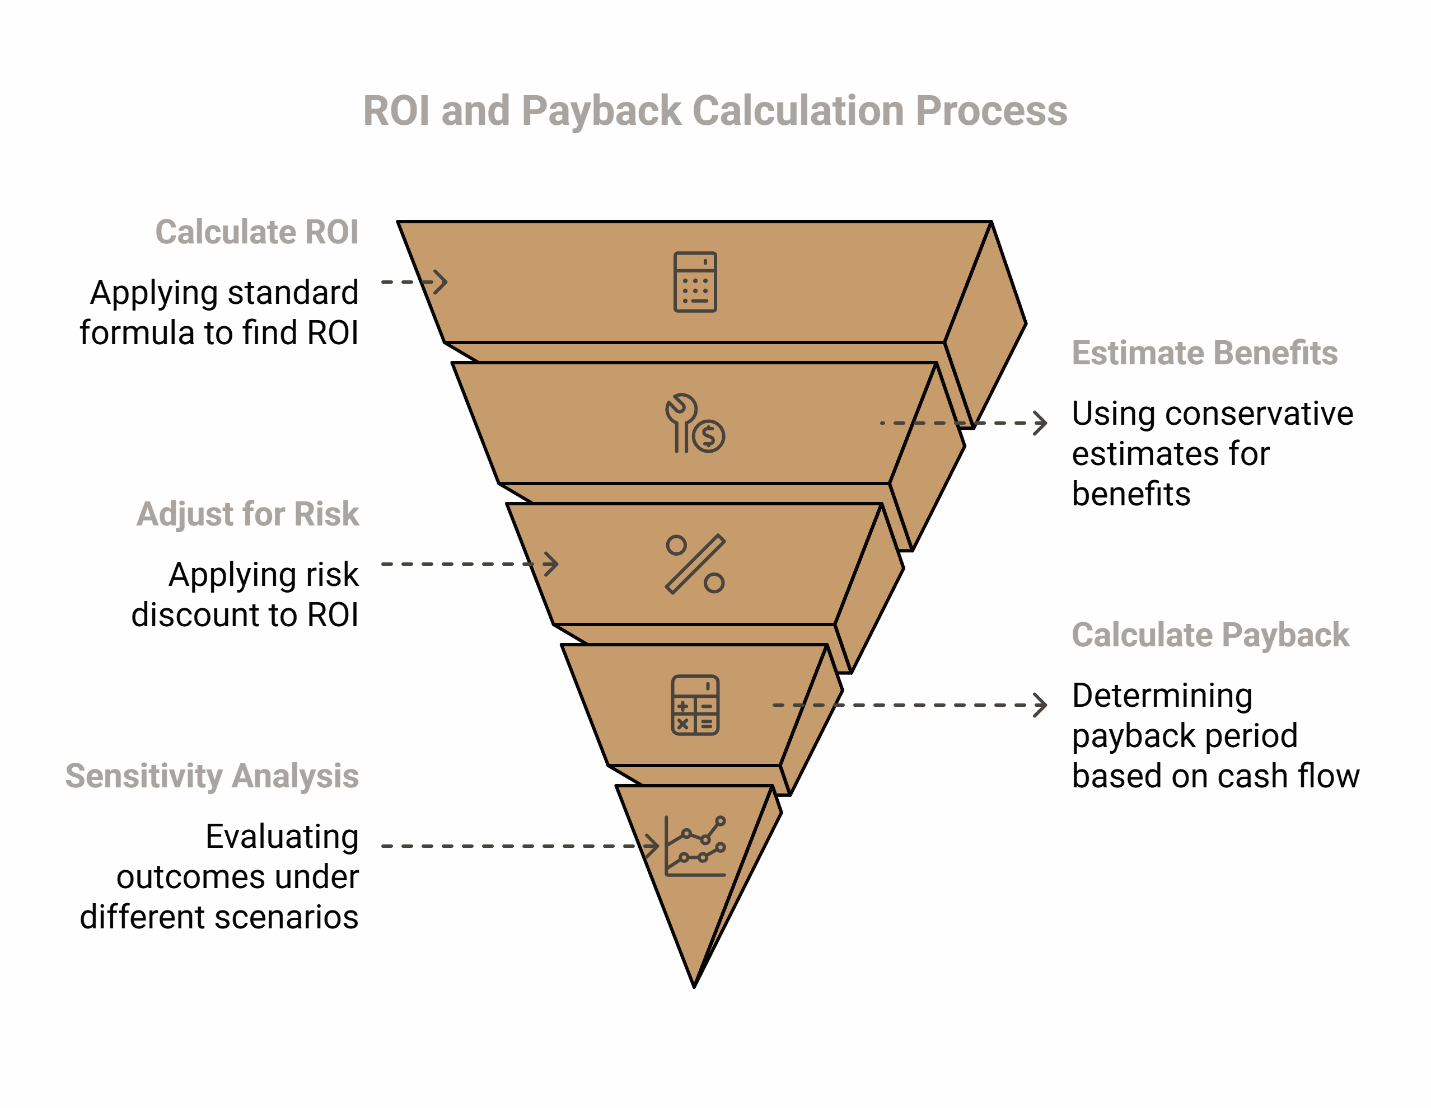
ROI calculation follows standard enterprise finance formulas. The basic calculation divides annual benefit value minus annual total cost by annual total cost:
ROI (annualized) = (Annual Benefits − Annual Costs) ÷ Annual Costs
Payback Period = Initial Investment ÷ Annual Net Cash Flow
The numerator requires conservative estimates: if pilot data shows 3.5% renewal lift, model 2.5% for the full portfolio to account for variation across properties. If labor savings calculations assume 40 hours monthly per property, use 30 hours to account for incomplete adoption and workflow variability.
Risk-adjusted ROI acknowledges implementation and adoption uncertainty:
Risk-Adjusted ROI = ROI × (1 − Risk Discount)
Apply a discount factor between 10-25% as a conservative adjustment depending on integration complexity, change management scope, and portfolio operational maturity. Higher discounts reflect greater uncertainty; lower discounts apply when pilot results strongly validate assumptions.
Calculate specific benefit values using these formulas:
Renewal lift value = (Units × Avg monthly rent × Renewal lift %) × Months in period
Labor hours avoided = (Hours saved/month × Fully loaded hourly rate) × 12
Payback period matters more to many CFOs than ROI percentage. A $150,000 implementation generating $85,000 in annual benefits produces a 1.8-year payback—within the acceptable range for most operations technology investments. Extending that to 2.5 years by reducing benefit assumptions provides risk-adjusted guidance.
Sensitivity analysis demonstrates how assumptions drive outcomes. Show payback periods under three scenarios: conservative (low renewal lift, modest labor savings), expected (pilot-validated metrics), and optimistic (high-end performance). The conservative case should still produce acceptable payback; if it doesn't, the business case needs strengthening before advancing.
Operations & IT Lens: Reliability, Security, and Integration Readiness
Reliability is the foundation of trust. Technical due diligence examines event timing, ensuring that critical processes like move-in provisioning or service request routing execute flawlessly across systems. When resident workflows span multiple platforms—a move-in process triggers actions in the PMS, access control system, and communication platform—the unified platform must orchestrate these events reliably, handling failures gracefully when downstream systems experience delays or outages.
System reliability ensures that retried operations don't create duplicate records or conflicting state. If a network timeout interrupts access credential provisioning, the system should safely retry without creating multiple credentials or leaving residents locked out. This isn't just technical precision—it's operational reliability that prevents service escalations and maintains the resident trust that defines premium living environments.
Access controls limit what each platform component can do within connected systems. The integration layer accessing your property management software should have read-only access to resident data and write access only to specific workflow endpoints, not administrative functions. Security teams scrutinize these permission boundaries because excessive access creates audit concerns and breach exposure.
For U.S. multifamily operators, align security controls with established frameworks. The NIST Cybersecurity Framework 2.0 provides risk-based, outcome-focused guidance across six core functions. ISO/IEC 27001:2022 defines information security management system requirements for systematic risk treatment. The CISA Zero Trust Maturity Model offers practical maturity progression across identity, devices, networks, applications, and data—particularly relevant for access control integration planning.
Monitoring and escalation paths define how the operations team detects and resolves issues before residents notice. Real-time dashboards showing service request queue depths, integration health status, and access provisioning success rates allow proactive intervention. Automated alerts when SLA thresholds approach trigger response protocols before violations occur, maintaining the seamless service experience residents expect.
Objections & Risk Adjusters (and How to Handle Them)
Vendor lock-in concerns typically surface during legal review. Counter this objection by documenting data export capabilities and API access that enable eventual migration if needed. Pilot exit criteria—defined conditions under which you would terminate the pilot—demonstrate that commitment follows validation rather than preceding it. Strategic technology investments always involve switching costs, but structured pilot phases with clear performance gates ensure evidence-based commitments rather than speculative ones.
Integration risk represents a legitimate technical concern, particularly with older PMS platforms or proprietary access control systems. Address this through phased rollout: start with properties using modern, well-documented systems, validate the integration patterns, then extend to more complex environments. The pilot should specifically test integration failure scenarios—what happens when the PMS experiences downtime, how does the platform handle API rate limits, how quickly can staff revert to manual processes if needed.
The best systems elevate staff competency, they don't burden it. Modern multifamily property management software must feel intuitive to users familiar with consumer applications, ensuring rapid adoption with minimal disruption. Pilot data showing rapid adoption curves and minimal support ticket volume provides the strongest counter-evidence to training burden concerns.
The Justification Model Canvas
The Canvas organizes all decision inputs into a structured, one-page framework. Use this template to populate your business case with portfolio-specific data:
1. Problem / As-Is Costs
- Current pain points: _______________________________
- Quantified impact: _______________________________
- Example: Service request resolution averaging 4.2 days, 18% resident dissatisfaction with maintenance response, $2,400 per-unit turnover costs
2. UREP Scope
- Core modules: _______________________________
- Integrations: _______________________________
- Example: Work orders, move-in/out, messaging, amenity bookings, identity/access provisioning; PMS + access control integration
3. TCO (Annualized)
- Platform subscription: $_______
- Integration build/maintenance: $_______
- Data governance/security: $_______
- Change management & training: $_______
- Admin/reporting: $_______
- Total Annual Cost: $_______
4. Benefit Buckets (Annualized)
- Renewal/NPS impact: $_______ (method: Units × Avg rent × Lift % × Months)
- SLA adherence/incident reduction: $_______
- Labor hours avoided: $_______ (method: Hours saved/month × Loaded rate × 12)
- Total Annual Benefits: $_______
5. Assumptions
- Portfolio units: _______
- Average monthly rent: $_______
- Fully loaded labor rate: $_______
- Risk discount factor: _______% (range: 10-25%)
- Hospitality-grade service standard: _______
6. Pilot KPIs (30–60 Days)
- Leading indicators: Time-to-resolution ↓ _____%, Adoption rate _____%, Reopen rate ↓ _____%
- Lagging indicators: SLA breaches ↓ _____%, NPS/CSAT ↑ _____
7. Payback & Risk Adjusters
- Base ROI: _______%
- Low scenario ROI: _______%
- High scenario ROI: _______%
- Payback period: _______ months
- Risk-adjusted ROI: _______% (applying _____% discount)
8. Scale Criteria
- Pilot KPI thresholds met: ☐
- Integration stability confirmed: ☐
- No critical security issues: ☐
- Cross-functional approval: ☐
- Ready for multi-region rollout: ☐
Next Steps: From Pilot to Multi-Property Scale
Scale readiness depends on more than pilot success metrics. Governance structures must extend across properties—defining who owns platform configuration decisions, how feature requests get prioritized, and which operational standards remain flexible versus mandatory. RACI matrices clarify whether corporate IT handles integrations while property managers control workflow customization, or whether a centralized operations team manages the entire platform.
Multi-property rollout typically proceeds in waves based on operational similarity. Properties with the same PMS and access control providers form natural cohorts. Properties with high staff turnover might deploy later, after stabilizing the team. The rollout calendar balances implementation bandwidth—you need technical resources for integration work and training capacity for staff onboarding—against business urgency and the commitment to maintaining uninterrupted hospitality-grade service.
Success criteria for scaled deployment mirror pilot KPIs but at portfolio level: aggregate renewal rates trending 2+ percentage points above pre-implementation baseline, service request resolution times sustaining improvement across all properties, and platform engagement rates remaining stable six months post-deployment. These portfolio-level metrics validate that pilot results generalize rather than representing local anomalies.
Frequently Asked Questions
What is the primary difference between a UREP and a standalone Resident App?
A unified resident experience platform orchestrates and measures end-to-end workflows across your property management, access control, and communication systems. The resident app represents the resident-facing interface, but the business case rests on backend orchestration—standardized playbooks, automated escalations, and cross-system data flow—not just a mobile front end. Without the orchestration layer, you have a prettier interface on top of the same fragmented processes.
Why prioritize leading indicators in a pilot?
Leading indicators like time-to-resolution and engagement rates surface within 30-60 days, while lagging outcomes like renewal rates require 6-12 month observation windows. Early directional signals help finance and operations teams make timely, risk-adjusted decisions about portfolio rollout rather than waiting a full lease cycle for conclusive proof. Leading indicators that trend positive build confidence; those that plateau or decline trigger intervention while pilot scope remains limited.
How should security be framed for approvals?
Map your platform's security controls to recognized frameworks that IT and compliance teams already understand. Reference alignment with NIST Cybersecurity Framework 2.0 outcomes, ISO/IEC 27001:2022 information security management practices, and CISA Zero Trust principles for identity and access. Emphasize systematic access patterns, auditable event logs, and reliable integration design. Security framed through established standards demonstrates mature governance rather than vendor-specific claims.
Disclaimer
This article is designed to educate multifamily operators and does not constitute legal, financial, or security advice. Please evaluate solutions within your organization's governance, risk, and compliance framework.
Our Editorial Process
Every piece is extensively rewritten, fact-checked, and enriched with examples, diagrams, and references so it's genuinely useful to the intended reader. We prioritize precision, clarity, and progressive disclosure.
About the ElevateOS Insights Team
We analyze how unified platforms, integrated operations, and hospitality-grade services drive measurable resident outcomes across Class A portfolios. Contact us via the site footer to suggest topics or share case studies.